Skip to product information
1 of 7
20% OFF

RM-65 Radon Detector for Home Basement

RM-65 Radon Detector for Home Basement

Regular price $99.99 USD
Regular price $129.99 USD Sale price $99.99 USD

Earn [points_amount] when you buy this item. Join Reward Program to get points for your purchase.

  • Fast 6-hour radon detection with advanced high-accuracy sensor system
  • 2.0” color screen displays multiple time frames and average values
  • 45-day runtime with 3.7V USB-C rechargeable battery
  • Internal memory stores up to 504 days of radon data
  • Custom sound and light alarms with adjustable threshold settings
  • Compact 123g design meets EPA, WHO, and EURATOM standards

In stock

View full details
Description
Review
  • Invisible

    Radon is a colorless, odorless, and tasteless gas. Only a detector can reveal its presence.

  • Cancer Risk Factor

    Radon is the second leading cause of lung cancer, especially among non-smokers.

  • As Bad as Smoking

    Exposure to 4 pCi/L of radon equals the risk of smoking 8 cigarettes per day.

  • Always Changing

    Radon levels fluctuate constantly due to weather, season, and ventilation conditions.

Family laughing on couch with Airthereal radon detector on table.

What is a Radon Detector?

A radon detector is a device that monitors radon gas levels indoors. Radon is a colorless, odorless radioactive gas that can build up over time and pose health risks. Regular monitoring helps ensure a safe living environment.

U.S. map showing radon risk zones (HIGH: red, MED: orange, LOW: yellow) per EPA.

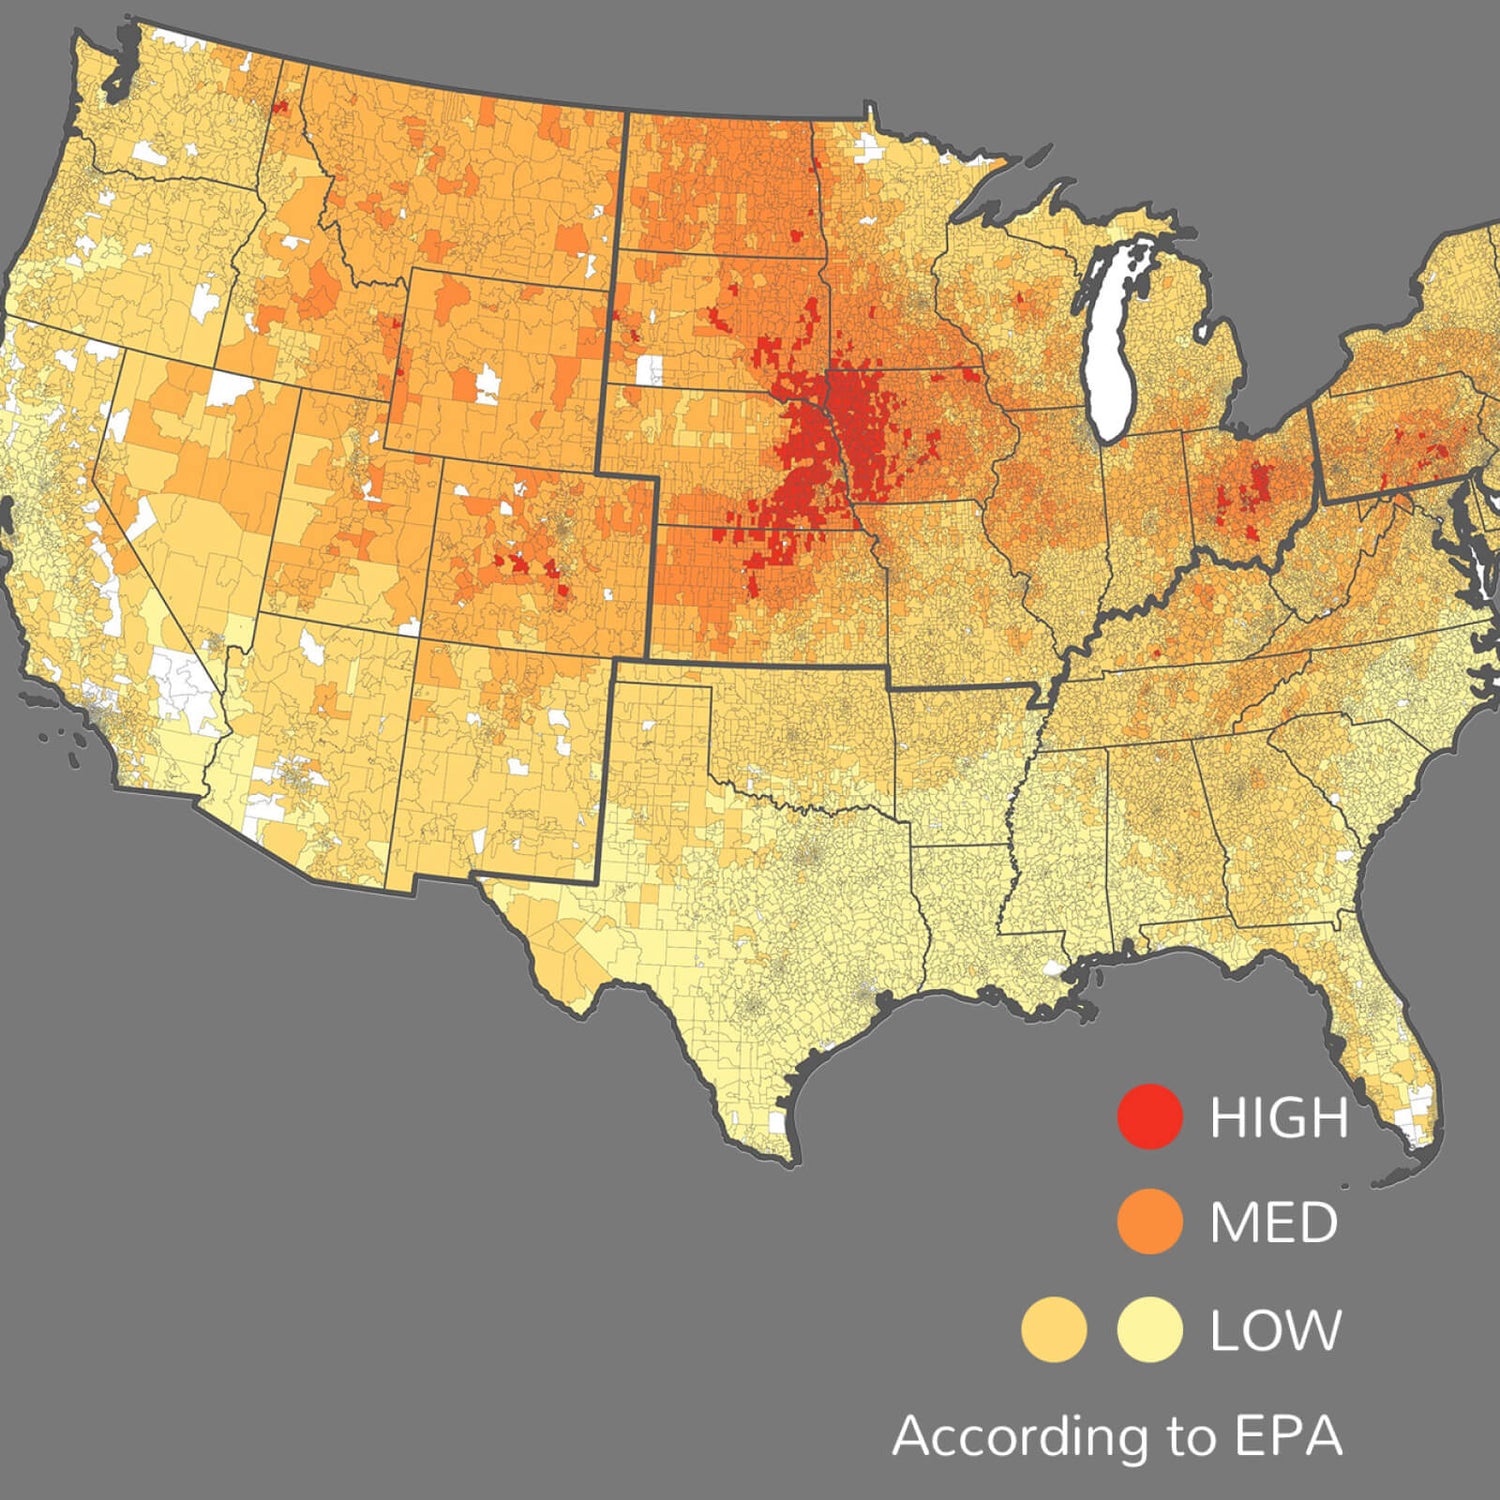
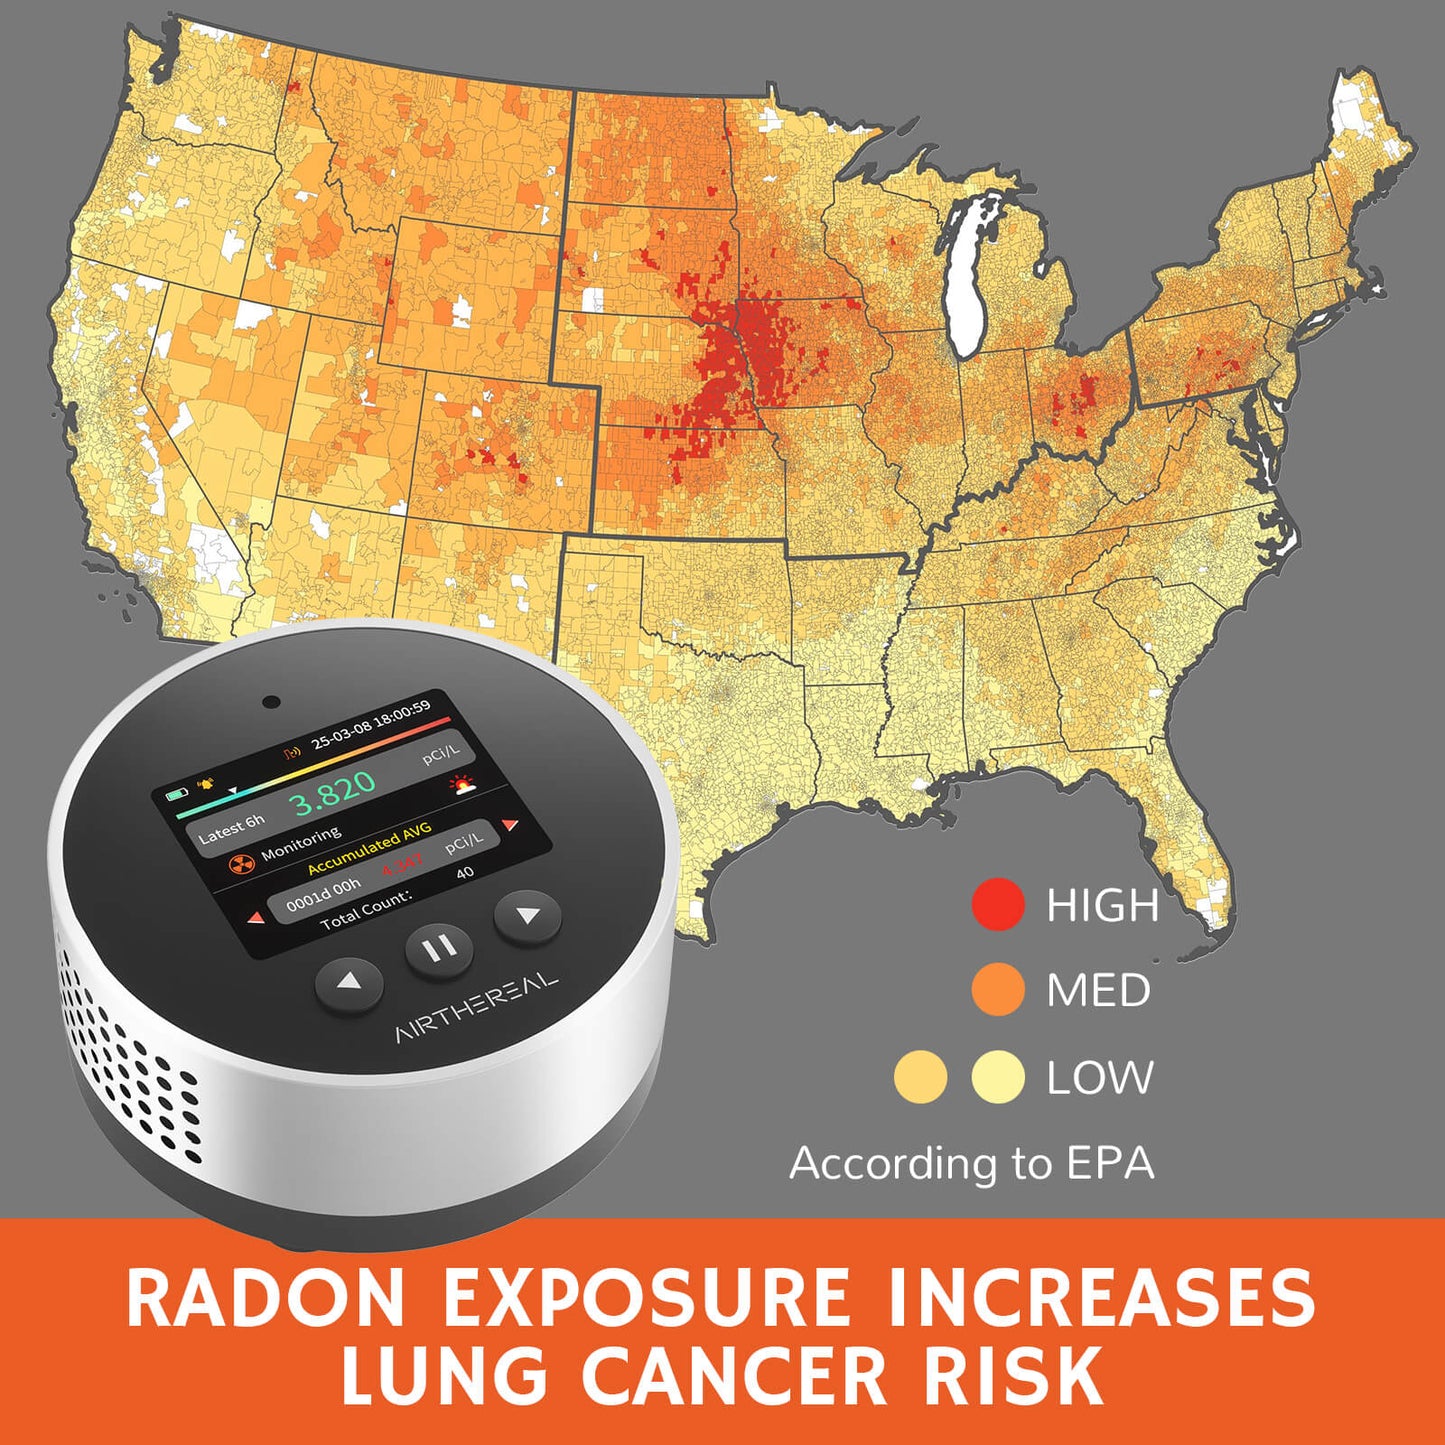
Where Is Radon Most Common in the U.S.?

In the U.S., radon is most common in the Midwest, northern states, and mountainous regions. Key points per the EPA:

- High-risk (red zones): Iowa, North Dakota, South Dakota, Minnesota, Wisconsin, Illinois, Nebraska, Colorado, and parts of Pennsylvania/Ohio, where levels often exceed 4.0 pCi/L.

- Medium-risk (orange zones): Areas surrounding high-risk regions with moderate radon levels.

- Low-risk (yellow zones): Southern and coastal states with lower radon levels.

Risk differences stem from local soil and geological factors affecting radon seepage into buildings.

Cross - section of a multi - level house with arrows showing air flow paths. Features living spaces, garage, and outdoor greenery. Relevant to radon detector use in home environments.

How Radon Enters Your Home?

Radon seeps into homes from soil gas, which forms as uranium in bedrock and topsoil decays. It creeps in through pathways like cracks in foundations, drains, crawl spaces, dirt floors, and even gaps around fittings or windows. Trapped indoors by poor ventilation, it can build to risky levels. Test your home and seal these entry points to stay safe!

Button label

Radon Levels & Actions

Radon Levels Chart: 3 zones (red: >4 pCi/L, yellow: 2.7–4 pCi/L, green: <2.7 pCi/L) with mitigation/monitoring steps. Radon Levels Chart: 3 zones (red: >4 pCi/L, yellow: 2.7–4 pCi/L, green: <2.7 pCi/L) with mitigation/monitoring steps.

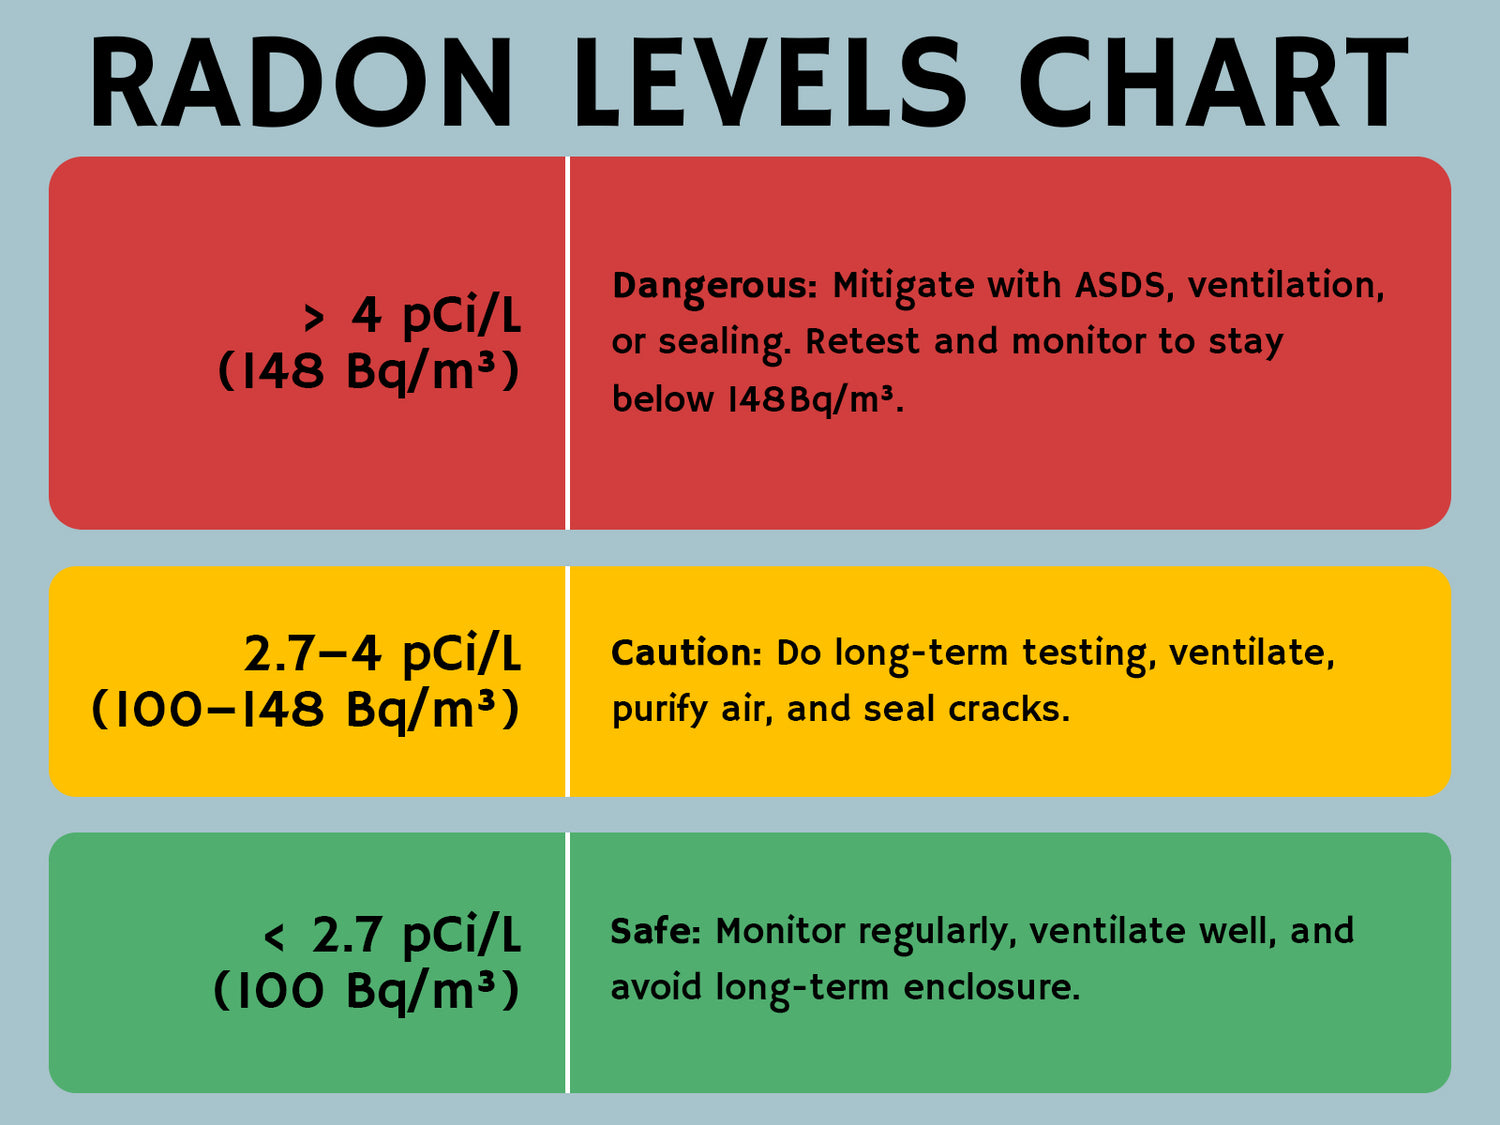
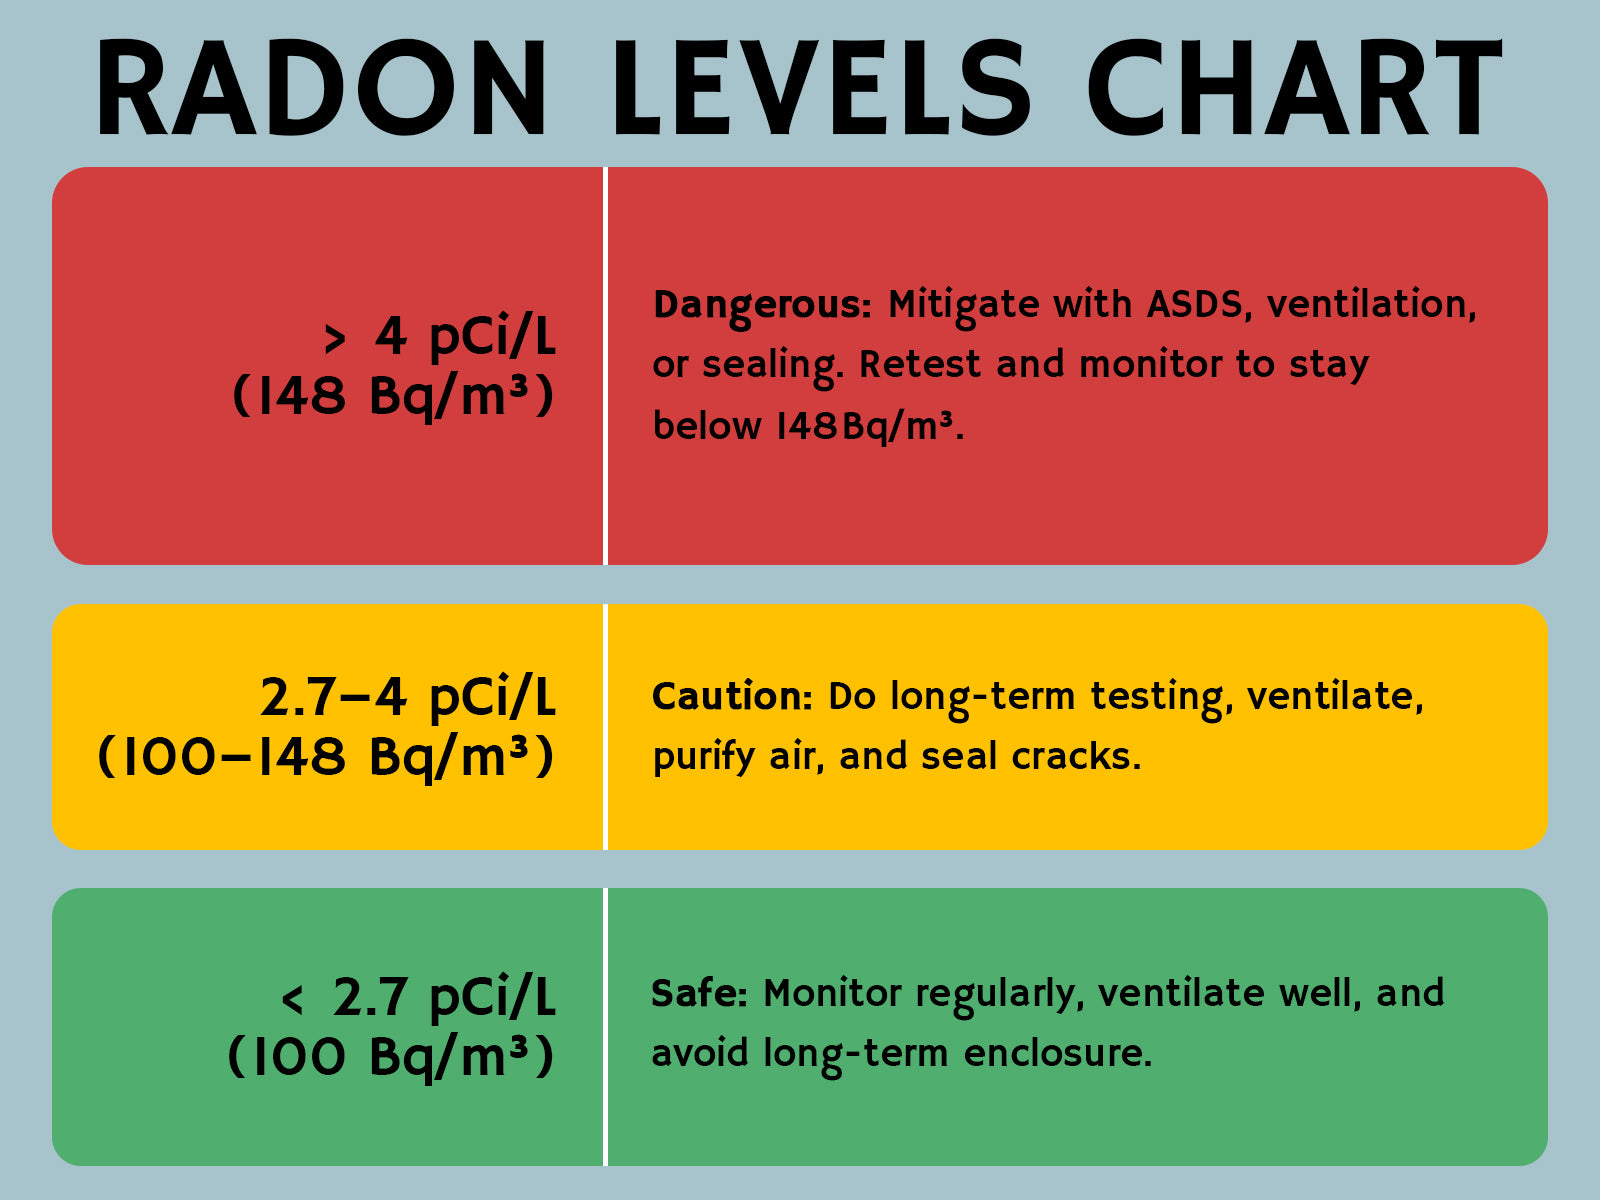
To minimize radon exposure, choose low-emission building materials when possible. For newly renovated homes, use a radon detector to confirm safe levels before moving in. If you live in a high-risk area (check local government or EPA maps), consider long-term monitoring with a reliable radon detector. When levels are elevated, improve ventilation by opening windows or using exhaust fans. For persistent issues, seal foundation cracks or install professional mitigation systems to ensure safety.
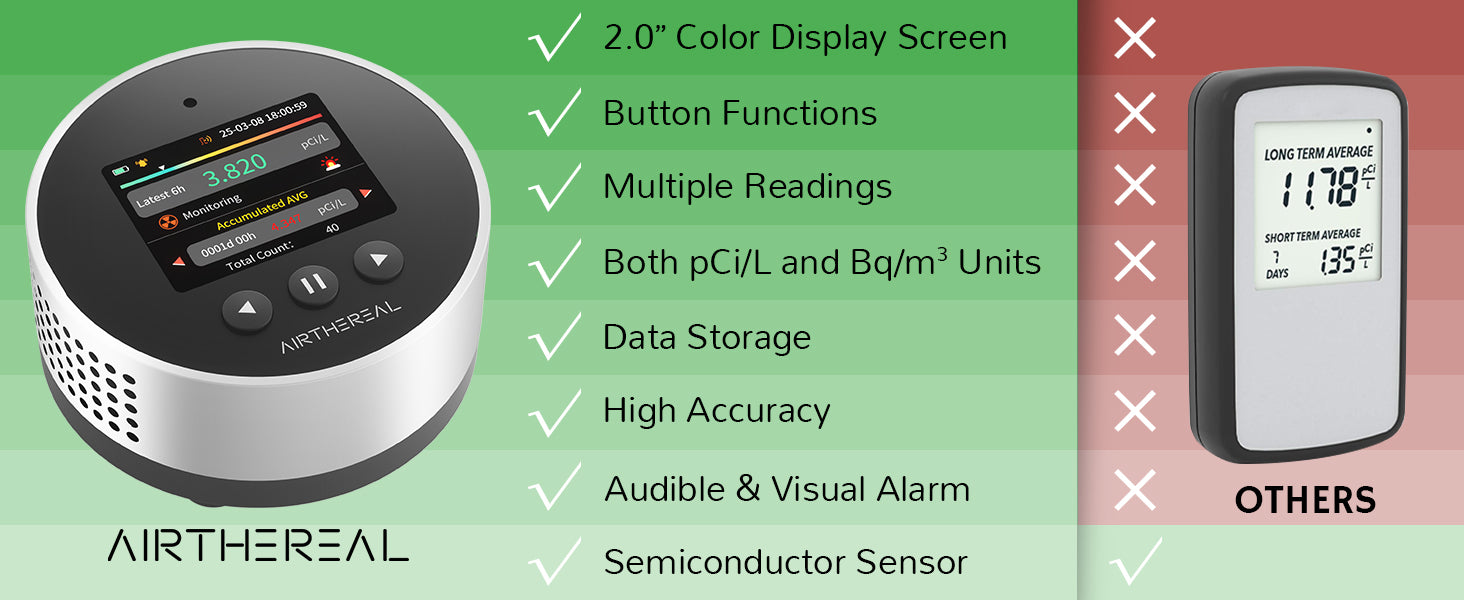
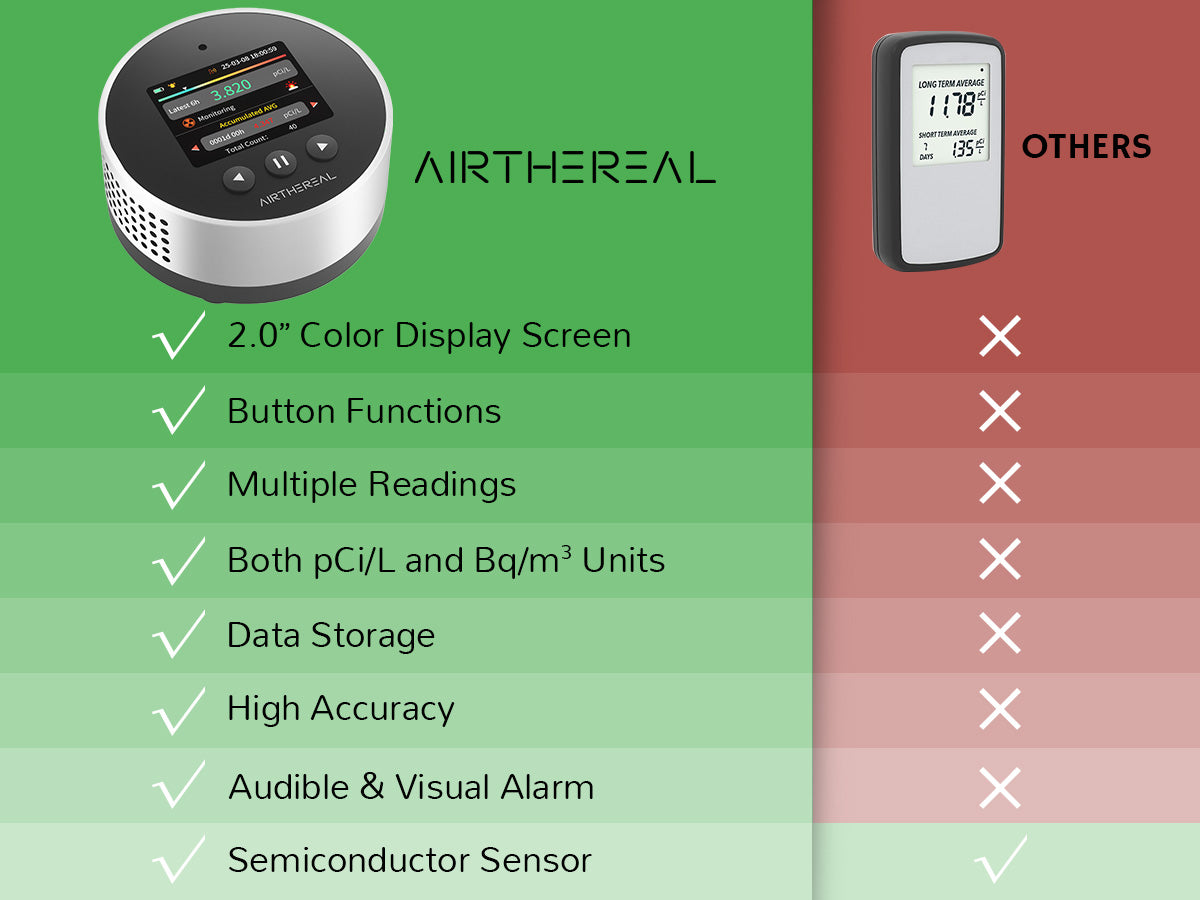
Compare to Others

Comparison of Airthereal radon detector (left) vs another (right). Airthereal has 2.0 Comparison of Airthereal radon detector (left) vs another (right). Airthereal has 2.0

FAQ

What causes a sudden surge in detection differences?

A sudden surge in abnormal differences may rarely be due to light leakage. To determine if it is caused by light leakage, you can observe whether the difference always occurs in a specific detector. If a particular detector frequently shows a sudden surge in differences, it is likely related to this issue.

In which cases are the differences considered normal?​

Differences caused by the following situations are normal and related to the characteristics of radon or the environment:​

  • Impact of air circulation: Radon is 8 times heavier than air. If the air in the detection environment is not circulating, radon tends to accumulate and distribute unevenly, which will increase the probability of differences.​
  • Random distribution of radon in the air: The random distribution of radon in the air may lead to obvious short-term differences even between two detectors that are very close to each other. In this case, it is recommended to use the "cumulative average value of continuous observation" as the judgment basis (for example, a certain real-time data is 4.3/7.7, with an accuracy difference of 28%, but the cumulative average value is 5.6/6.7, which is within the marked 15% error range, that is, it meets the standard).​
Does the difference in detector data indicate insufficient reliability?​

On the contrary, a reasonable range of differences can better reflect the reliability of the detector, which is also one of the product highlights. Some low-end detectors on the market generate data only based on internal algorithms, so their values may appear more consistent, but cannot reflect the real radon data. The differences of this radon detector come from the accurate capture of real radon data, and the data fluctuation conforms to the natural characteristics of radon. It also proves that it can truly restore the radon status in the environment and has higher reliability.